Updated
Parts Inventory Software: How Parts Inventory Management Software Works and Which Tool Fits
Parts inventory software keeps a live count of spare parts, MRO stock and consumables at every location, raises a reorder when a bin drops below its minimum, and issues parts against work orders so usage is recorded per machine. Most teams buy it as a module inside a CMMS such as UpKeep, MaintainX, Limble or Fiix, a fleet maintenance tool such as Fleetio, a repair-shop system such as Protractor, or a construction equipment platform such as Tenna.
Standalone inventory apps such as Sortly cover smaller stockrooms that do not run work orders. The rest of this page compares the tool types, then covers the parts-specific features (min/max, criticality, kitting, MRO) that decide whether a tool fits.
A $12 hydraulic fitting shuts down a $400/hour production line for two days because nobody knew the bin was empty. A maintenance tech drives 90 minutes round-trip to grab a bearing that was sitting in a different warehouse the whole time. An engineering change renders 2,000 filters obsolete, and they sit on shelves for a year before anyone notices.
Parts inventory is a different animal from finished goods. The SKU counts are enormous, the demand is intermittent, and the cost of a stockout isn't a lost sale. It's a halted crane, a grounded truck, or a factory floor going dark.
Parts Inventory Software Compared: 8 Tools by Type
Start from where the parts get used. Parts that go into machines on a maintenance schedule belong in a CMMS. Parts that go into vehicles belong in a fleet maintenance tool. Parts sold over a counter or billed on repair orders belong in shop management software. Picking the category first removes most of the list.
| Tool | Type | Best fit | Parts are issued against |
|---|---|---|---|
| UpKeep | CMMS | Facility and plant maintenance teams | Work orders and assets |
| MaintainX | CMMS | Plant and field maintenance teams | Work orders and assets |
| Limble | CMMS | Manufacturing and facilities | Work orders and assets |
| Fiix (Rockwell Automation) | CMMS | Manufacturing plants | Work orders and assets |
| Fleetio | Fleet maintenance | Vehicle and equipment fleets | Service entries per vehicle |
| Protractor | Shop management | Auto and truck repair shops | Repair orders and invoices |
| Tenna | Construction equipment platform | Contractors running heavy equipment | Equipment maintenance records |
| Sortly | General inventory app | Small stockrooms and field crews | Items and folders by location |
| Airpinpoint (add-on) | Physical location tracking | Bins, kits, carts and vans that move between sites | Tagged containers on a map |
Two features separate a parts tool from a general inventory app. Work-order issuing means a part leaves stock against a specific machine and job, so you can see that one pump has used six seals this year. Criticality means a $12 seal that stops a line gets a higher minimum than a $400 part with a two-day lead time. A tool without both is an inventory app, which suits a stockroom and leaves a maintenance shop guessing.
Airpinpoint does not count parts. It shows where a tagged bin, kit, cart or service van is on one map, keeps its location history and sends an email or webhook alert when it leaves a site, for $29 per tag one time plus $11.99 per tag per month. It sits next to whichever tool above holds your counts.
Why Parts Inventory Breaks Spreadsheets
General inventory management software works for tracking finished products through a warehouse. Parts inventory is harder for specific reasons.
SKU Proliferation
A single piece of heavy equipment can have 3,000+ unique part numbers. A fleet of 50 machines across three manufacturers means tens of thousands of SKUs, most of which move infrequently. Spreadsheets can list them. They can't tell you which ones actually matter.
Intermittent Demand
Finished goods move predictably: seasonal patterns, marketing pushes, steady reorder cycles. Spare parts don't. A specific O-ring might sit for 11 months, then get pulled six times in a week when a batch of valves starts failing.
This is the well-studied problem of intermittent demand, and it breaks the forecasting math rather than merely straining it. Exponential smoothing and moving averages assume demand arrives every period. When most periods are zero, the average converges on a number that is wrong in both directions: too high to justify the stock, too low to cover the week the valves fail. Croston's method and its variants exist specifically because of this, and they work by forecasting the size of a demand event and the interval between events separately.
You do not need to implement Croston to benefit from the insight. You need to know which of your SKUs have intermittent demand, because those are the ones where a min/max set from an average will be wrong. Pull 24 months of issue history and count, per SKU, how many months had zero movement. Sort descending. Everything at the top of that list needs a criticality-based rule, not a forecast.
Criticality Asymmetry
Not all stockouts are equal. Running out of shop towels is an inconvenience. Running out of a specific PLC module means a $200,000/day production line stops. Parts inventory management has to classify items by criticality, and the reorder rules for each tier are fundamentally different.
Obsolescence
Engineering changes, model year updates, vendor discontinuations. Parts go obsolete constantly, and nothing in a stockroom tells you it has happened. The bin still looks full. The part number still scans. The only signal is absence: nothing has been issued against it since the fleet changed over.
That is why dead stock is discovered rather than detected. Somebody does a wall-to-wall count, or clears a shelf for something else, and finds parts for a machine sold three years ago. Run the query yourself before the audit does: list every SKU with zero issues in 12 months, multiply quantity on hand by unit cost, and sort. The total at the bottom of that report is capital you already spent and can still partly recover through returns, resale or warranty credit while the vendor relationships are warm.
Core Features of a Parts Inventory Management System
Min/Max Thresholds and Reorder Points
The foundation of parts inventory control. For every SKU, you set:
- Minimum: The count that triggers a reorder alert
- Maximum: The target quantity after restocking
- Reorder quantity: How many to order (often max minus current count)
- Lead time: Days from order to delivery, which determines when the alert fires
| Part Criticality | Min Threshold Logic | Example |
|---|---|---|
| Critical (line-stop) | 2x lead time demand + safety stock | Keep 6 if you use 2/month and lead time is 30 days |
| Essential (degrades operations) | 1.5x lead time demand | Keep 4 if you use 2/month with 30-day lead |
| Standard (convenience) | 1x lead time demand | Keep 2 if you use 2/month with 30-day lead |
| Non-critical (deferrable) | Reorder on demand | Order when requested, no stock held |
Good parts inventory management software lets you set these per-SKU and sends alerts before you hit zero, not after.
Multi-Location Visibility
Parts spread across main warehouses, satellite stockrooms, service vans, job-site trailers, and tool cribs. A parts inventory management system shows real-time counts at every location on one screen.
This matters most when a tech at Site A needs a part that's out of stock locally but sitting in a bin at Site B, 20 minutes away. Without visibility, that tech orders a new one with overnight shipping for $85. With visibility, they drive across town and get it for free.
Usage Tracking and Analytics
Knowing what you have is step one. Knowing how fast it moves is where optimization starts.
Key metrics a parts tracking system should surface:
- Turnover rate by SKU: How many times per year each part cycles through inventory
- Days of supply: Current count divided by average daily usage
- Stockout frequency: How often each SKU hits zero
- Dead stock identification: Parts with zero movement in 6-12 months
- Cost of carrying: Holding cost per SKU per month. Standard supply chain planning practice puts annual carrying cost somewhere between 20% and 30% of inventory value once you add up capital cost, storage, insurance, obsolescence and shrink. Build your own figure from those five components rather than adopting the rule of thumb, because the capital cost line alone swings with your borrowing rate
Barcode and BLE Tracking
Manual bin checks don't scale past a few hundred SKUs. Scanning does.
Barcode scanning handles receiving, issuing, and cycle counting. A tech scans a part when they take it from the bin, and the count updates instantly across all locations.
BLE (Bluetooth Low Energy) tracking adds a location layer. Attach a small BLE tag to high-value parts bins, kits, or portable tool cribs, and the system tracks where they are physically. This is where Airpinpoint's BLE tracking fits: real-time location for parts that move between sites, with no cellular subscription per tag.
Kitting and Work Order Integration
Maintenance work orders consume multiple parts. A pump rebuild might require 14 different SKUs. Kitting lets you:
- Define a parts list per job type
- Reserve those parts against a work order
- Pull them as a kit (one scan vs. fourteen)
- Auto-decrement all SKUs simultaneously
Without kitting, techs grab parts ad-hoc, counts drift, and the next job finds half its parts missing.
MRO Inventory: A Special Case
Maintenance, Repair, and Operations (MRO) inventory is the subset of parts inventory that keeps equipment running. It includes consumables (lubricants, filters, gaskets), repair parts (bearings, seals, motors), and operating supplies (PPE, cleaning agents).
MRO inventory is notoriously hard to manage because:
- It's not revenue-generating, so it gets less management attention than finished goods
- Spend is fragmented across dozens of vendors and thousands of POs
- Duplicate SKUs accumulate when different techs order the same part under different vendor part numbers
- Storage is decentralized, with parts stashed in tool boxes, truck beds, and desk drawers
MRO Optimization Strategies
| Strategy | How It Works | How to Size the Payoff Yourself |
|---|---|---|
| SKU rationalization | Consolidate duplicate part numbers | Export your SKU list, fuzzy-match on description and manufacturer part number, and count the duplicate pairs. Each pair is a bin you can empty and safety stock you are holding twice |
| Vendor consolidation | Fewer vendors, better pricing | Sort last year's POs by vendor. Count how many vendors account for the bottom 5% of spend. Those are the accounts costing you more in AP processing than they are worth in price |
| Criticality analysis | Stock based on failure impact, not habit | For each A-tier SKU, ask what actually stops if it runs out. Most stockrooms find items carrying A-tier safety stock because of one bad week in 2019 |
| Consignment programs | Vendor owns stock until you use it | The cash effect is the carrying cost on that stock, at your own carrying rate. Ask what the vendor charges for the privilege, because it is rarely free |
| Cycle counting | Count a portion daily vs. annual wall-to-wall | Measure the gap between system count and physical count on the SKUs you count this week. That variance is your current accuracy, and it is the baseline any improvement gets measured against |
No table can tell you what these are worth at your operation, and anyone who quotes you a percentage without seeing your data is guessing. What is generally true is directional: a wall-to-wall count produces a spike of accuracy once a year that decays over the following twelve months, while cycle counting trades that spike for a level you maintain. Which matters more depends on whether your pain is the year-end number or the Tuesday afternoon stockout.
Choosing the Right Parts Inventory Management Software
What to Look For
Must-haves for parts-heavy operations:
- Min/max with automated alerts (not just manual reorder reports)
- Multi-location tracking with transfer workflows
- Barcode/QR scanning on mobile devices
- Work order integration or at minimum, kit-based issuing
- Criticality classification per SKU
- Usage analytics with turnover and dead stock reports
Nice-to-haves:
- BLE or GPS location tracking for high-value parts and mobile stockrooms
- Vendor catalog integration for one-click reordering
- ABC classification automation (A = 80% of spend in 20% of SKUs)
- Serial number tracking for warranty and traceability
Software Categories
| Category | Examples | Parts Strength | Weakness |
|---|---|---|---|
| CMMS/EAM | Fiix, UpKeep, Limble | Built for MRO parts, work order integration | Weak on multi-site logistics |
| General inventory | Sortly, inFlow, Snipe-IT | Easy setup, low cost | No criticality tiers, no work orders |
| ERP parts modules | SAP, Oracle, NetSuite | Deep integration, enterprise scale | 6-18 month implementation, high cost |
| Physical tracking + inventory | Airpinpoint | Real-time location, multi-site visibility, BLE tags | Not a full CMMS |
The right choice depends on whether your primary pain is knowing what you have (inventory software), maintaining equipment (CMMS), or finding where parts physically are (tracking platform like Airpinpoint).
Cost Comparison
For a detailed pricing breakdown across software categories, see our inventory management software cost guide.
Quick reference for parts-specific solutions:
| Solution Type | Monthly Cost | Per-Part Cost |
|---|---|---|
| Spreadsheet + manual counts | $0 (software) | $0 + labor |
| Basic inventory app | $50-150/month | Included |
| CMMS with parts module | $200-800/month | Often per-user |
| Enterprise ERP | $1,000-5,000+/month | Per-module |
| Airpinpoint (physical tracking) | $11.99/tag/month, volume discounts | $29 per tag one time, per tracked bin/kit/van |
Note the different unit. The software rows are priced per company or per user and cover every SKU you enter. Airpinpoint is priced per physical thing you tag, so it is not a substitute for those rows and it does not scale to tagging individual bolts. It is the row you add when your remaining problem is that the bin, the kit or the van has physically gone somewhere nobody can name.
Setting Up Parts Inventory Tracking
Step 1: Audit What You Have
Before any software, do a wall-to-wall count. You'll find:
- Dead stock that's been sitting for years
- Duplicate SKUs under different part numbers
- Parts in locations nobody documented
- Counts that disagree with the spreadsheet, usually worst on the cheap fast-moving items nobody bothers to record
Record the variance per SKU as you count, not just the corrected number. The variance is the more useful data: it tells you which parts of the stockroom your process is failing in, and it becomes the baseline you measure every later improvement against.
This is painful but necessary. Garbage data in means garbage data out, no matter how good the software is.
Step 2: Classify by Criticality
Assign every SKU a criticality tier. A simple framework:
- A (Critical): Stockout stops production or creates safety hazard. Keep safety stock. Never run out.
- B (Essential): Stockout degrades operations within 24 hours. Maintain min/max. Reorder promptly.
- C (Standard): Stockout is inconvenient but workable for 48+ hours. Reorder at standard intervals.
- D (Non-critical): Order on demand. No stock held.
A useful starting split is to keep A-tier under 10% of SKUs and B-tier under 20%, then let the evidence move items between tiers. The failure mode is tier inflation: every department argues its parts are critical, A-tier grows to a third of the catalog, and the classification stops meaning anything. Force the ranking by asking what stops, for how long, and what that hour costs. Anything that cannot answer all three is not A-tier.
Step 3: Set Min/Max Thresholds
Use historical consumption data if you have it. If you don't, start conservative (higher minimums) and adjust after 90 days of tracked usage.
Formula for minimum stock level:
Minimum = (Average daily usage x Lead time in days) + Safety stock
Safety stock by criticality:
- A-tier: 50-100% of lead time demand
- B-tier: 25-50% of lead time demand
- C-tier: 0-25% of lead time demand
- D-tier: 0
Step 4: Tag High-Value and Mobile Parts
Not every SKU needs a physical tracking tag. Focus BLE or barcode tracking on:
- Parts bins that move between locations
- High-value components (motors, PLCs, specialized tooling)
- Consignment inventory where you need to prove consumption
- Portable stockrooms, service vans, and job-site trailers
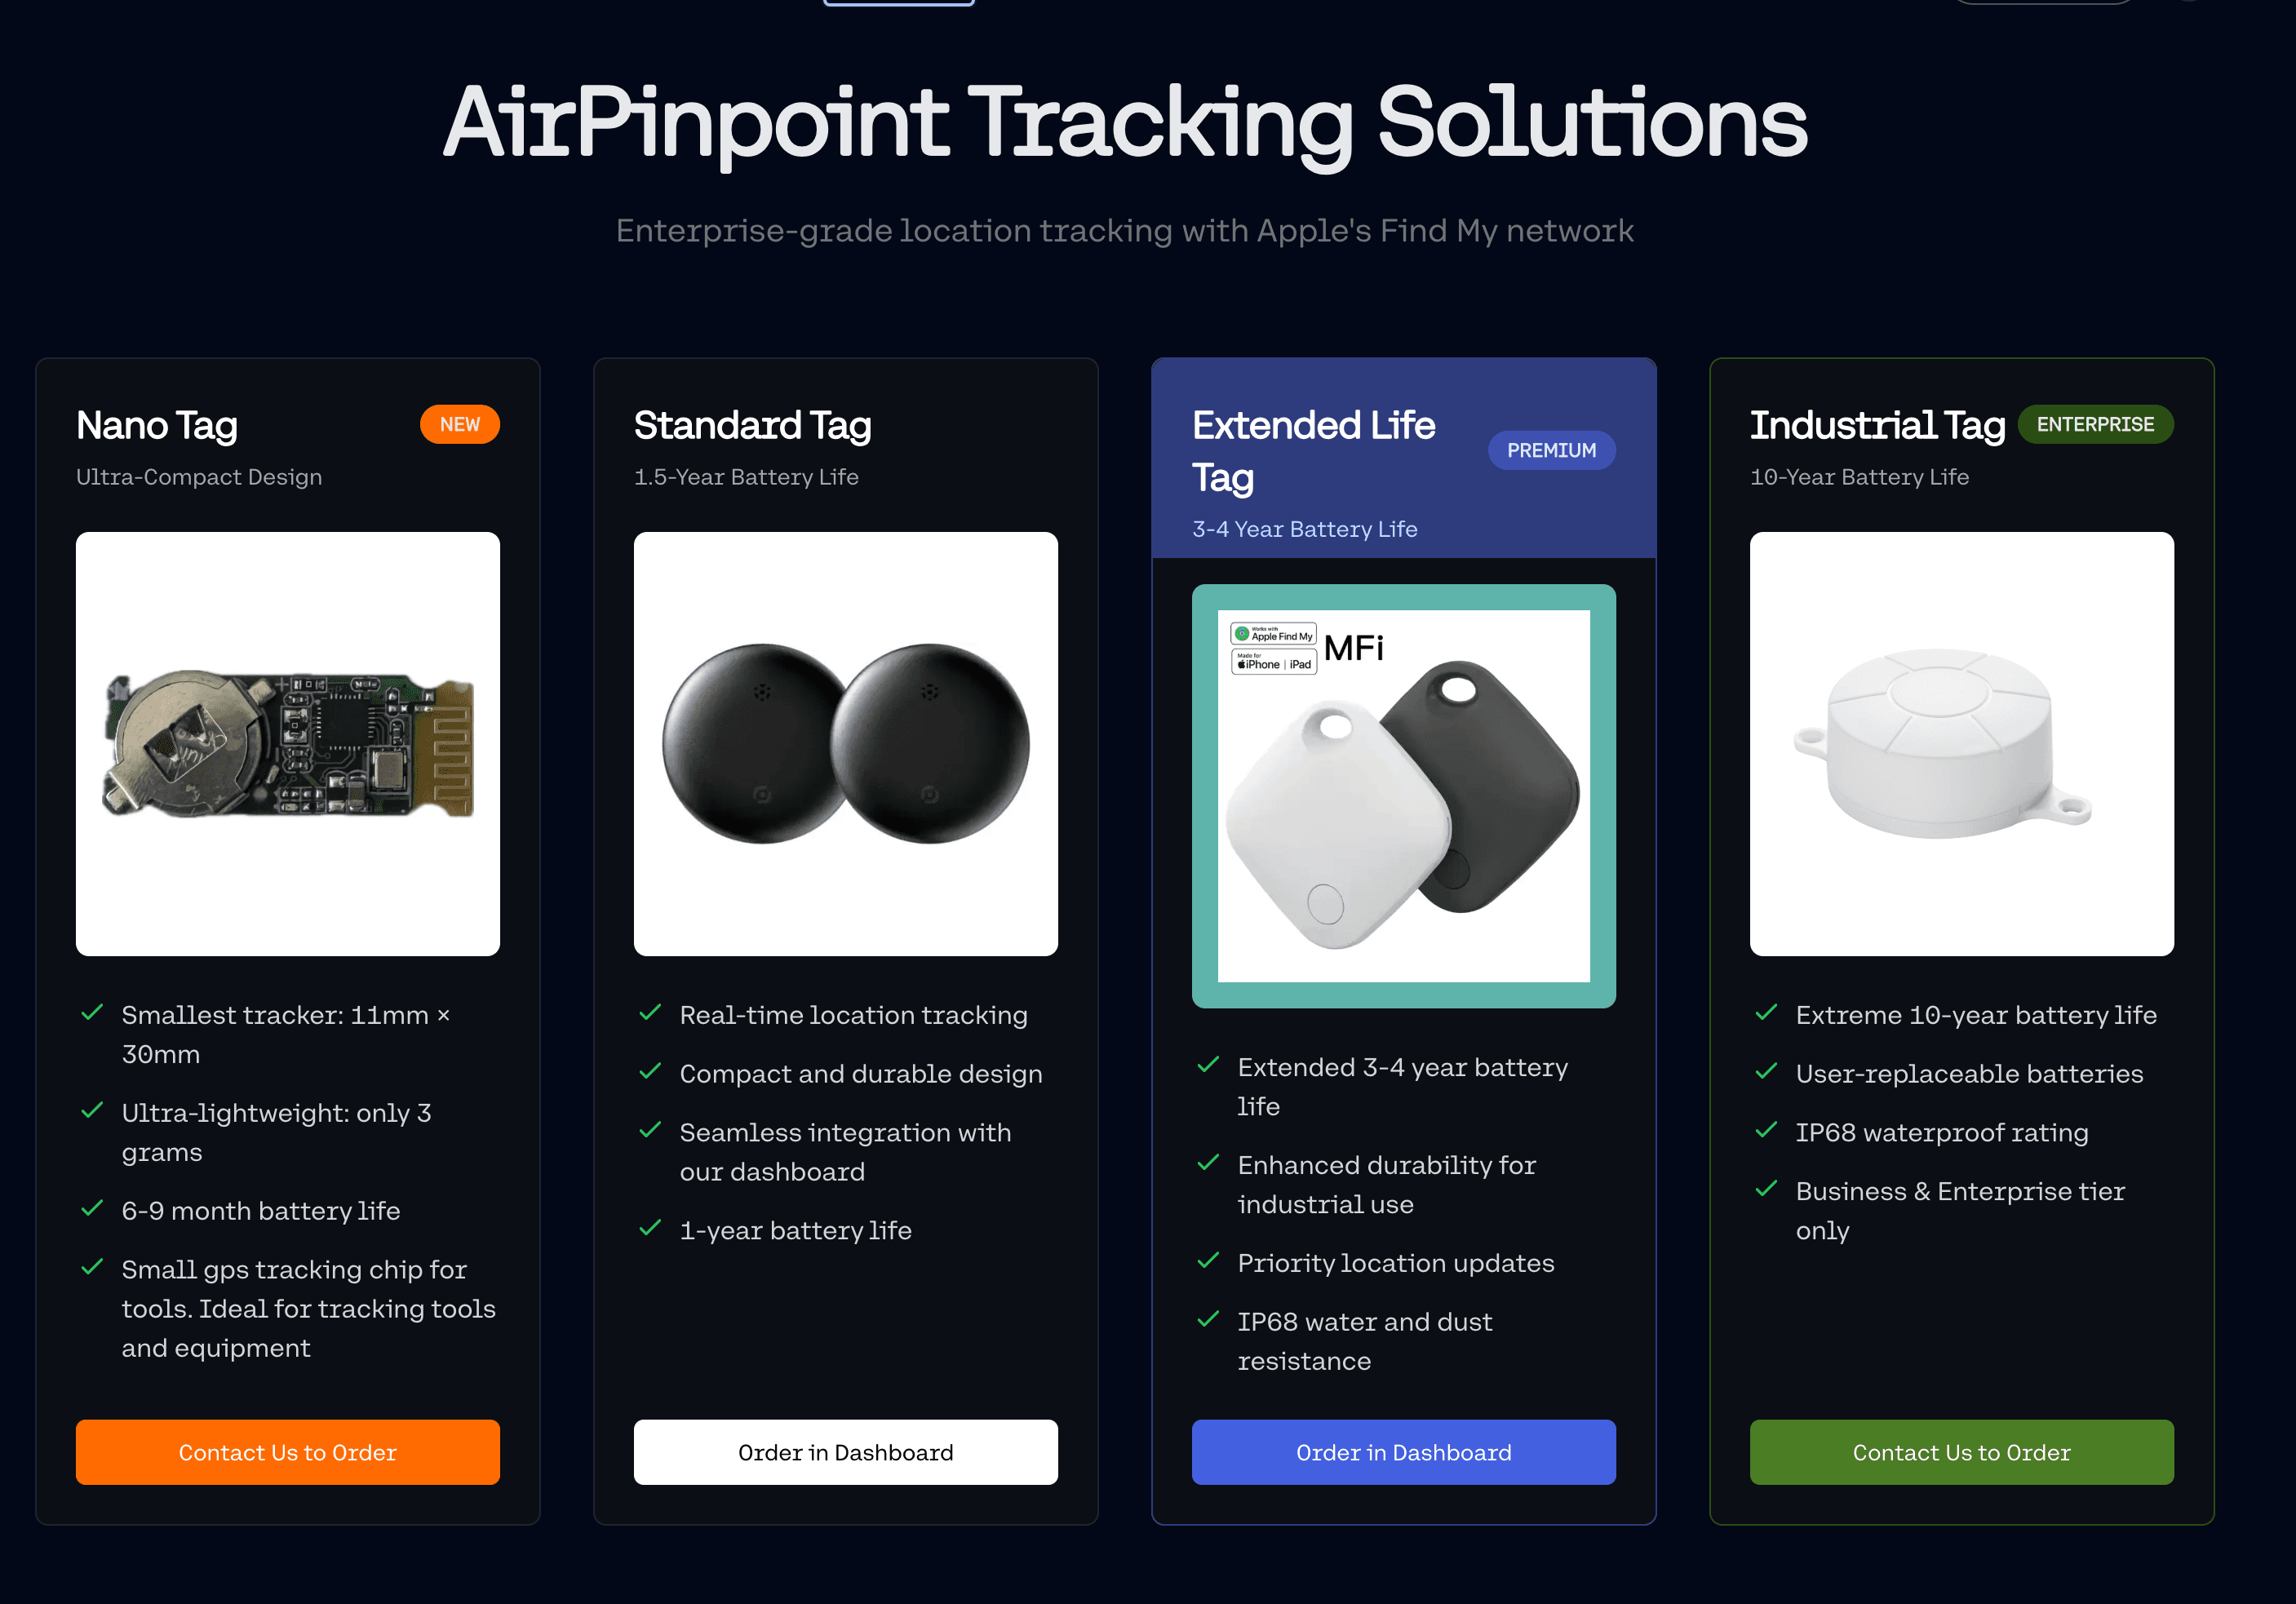
Airpinpoint's tags work well here: attach them to bins or kits, and the system tracks location across all your sites. The tags carry no SIM and no cellular plan, so there is no carrier bill per tag. You pay $29 per tag one time and $11.99 per tag per month for the dashboard, alerts, history and API, with volume discounts on larger deployments.
The limit worth knowing before you buy: a tag reports when an Apple device passes near it, so accuracy is roughly 10 to 30 meters and a bin sitting in a remote outbuilding may not report for a while. It tells you which yard the trailer is in, not which shelf the bearing is on.
Step 5: Cycle Count, Don't Wall-to-Wall
Annual physical inventories are disruptive and inaccurate by the time they're done. Cycle counting divides your inventory into segments and counts a portion each day or week.
| Tier | Count Frequency | Coverage |
|---|---|---|
| A (Critical) | Weekly | 100% of A-tier every month |
| B (Essential) | Monthly | 100% of B-tier every quarter |
| C/D (Standard) | Quarterly | 100% of C/D every year |
The mechanism is worth stating plainly, because it is the reason this works and not a claim you have to take on faith. An annual count corrects every error on one day and then lets error accumulate for twelve months. Cycle counting corrects a slice of errors every week, so the average error across the year is a fraction of what it is under an annual count, even though no single day is ever perfect. You are trading a peak for an average. Operations that care about year-end valuation want the peak. Operations that care about whether the bin has a bearing in it on Tuesday want the average.
Real-World Impact
We have no published customer case studies for parts inventory, so this section is about mechanism and measurement rather than numbers we cannot show you the receipts for. Two shapes of problem come up repeatedly. Here is how to tell whether you have them and what to measure.
Manufacturing Plant
The shape: a main stockroom plus satellite cribs. Parts exist in the building but not where the tech is, so a stockout is often not a stockout at all. It is a findability failure wearing a stockout costume.
How to tell if this is you: for the last ten emergency overnight orders, check whether that part was physically on site somewhere at the time you ordered it. Your receiving records and the other cribs' counts will tell you. If more than a couple were, your problem is visibility, not stock level, and buying more inventory will not fix it.
What to measure before you change anything:
| Baseline | Where it comes from |
|---|---|
| A-tier stockouts per week | Work orders held for parts |
| Minutes of downtime per stockout | Production log, start of hold to release |
| Monthly expedite spend | Freight invoices, filtered to overnight and next-day |
| Dead stock as a share of inventory value | Zero-issue-in-12-months query x unit cost |
What tracking changes: the expedite line and the search time, first and most directly. A bin with a tag on it is a lookup instead of a phone call to three cribs. What tracking does not change on its own: your min levels, your lead times, or a vendor who is chronically late. Those need the inventory system and the purchasing conversation, not a tag.
Field Service Fleet
The shape: vans as uncontrolled warehouses. Every tech carries stock, nobody can see across vans, so techs hoard the parts they have been burned on. The same SKU is simultaneously overstocked fleet-wide and unavailable to the tech who needs it today.
How to tell if this is you: count the same SKU across all vans and compare the total to your central stock. If the vans hold more than the warehouse does on popular items, hoarding is already priced into your inventory and you are paying carrying cost on it twice.
What to measure before you change anything:
| Baseline | Where it comes from |
|---|---|
| First-call fix rate | Work orders closed on the first visit, divided by total |
| Inventory value per van | A physical count of three representative vans |
| Return trips caused by a missing part | Work order notes, which is tedious and worth doing |
| Inter-van transfers per month | Almost certainly zero, because nobody can see what other vans hold |
What tracking changes: a tag on a van's parts bin puts the van on the same map as the warehouse, so a dispatcher can route a tech past a nearby van instead of writing a return visit. That is the concrete mechanism. It depends entirely on someone actually looking before they dispatch, which is a process change that a tag makes possible and does not make happen.
What it does not do: Airpinpoint does not count what is in the bin. It tells you the bin is at the Riverside job site rather than at the shop. Counts still come from your inventory system, and that division of labor is the honest way to scope this.
Integration with Existing Systems
Parts inventory doesn't exist in isolation. The most valuable integrations:
- CMMS/EAM: Auto-decrement parts when work orders close. Auto-generate POs when minimums hit.
- Purchasing/ERP: Send approved POs directly to vendors. Receive against POs to update counts.
- Accounting: Track parts cost by department, job, or equipment unit. Feed COGS calculations.
- RFID systems: Bulk scanning for receiving and cycle counts. Read 100+ tags per second vs. one barcode at a time.
For organizations conducting periodic reviews, our inventory audit guide covers audit procedures and checklists.
Getting Started
Parts inventory management doesn't require a six-figure ERP implementation. Start with the 20% of SKUs that cause 80% of your pain: the critical spares, the frequently stocked-out items, the parts that techs waste hours searching for.
Tag those first. Set min/max thresholds. Get multi-location visibility working. Then expand coverage as the system proves its value.
Airpinpoint tracks parts bins, kits, and mobile stockrooms with Find My tags at $29 per tag one time and $11.99 per tag per month, with volume discounts on larger deployments. No per-user fees, no cellular plan on the tags, and setup takes minutes per tag. If your parts inventory problem is less about software features and more about physically knowing where a bin, a kit or a van has got to across multiple sites, see pricing and start with the twenty things that go missing most.
 Our Solution