Fleet Tracking for Mixed Equipment
Most organizations run blended fleets: on-road vehicles, yard equipment and site machinery. The usual problem is not that any one of them is untracked, it is that they are tracked in three incompatible places. The trucks are in a telematics portal, the rented plant is on the rental company's app, and everything else is in somebody's head.
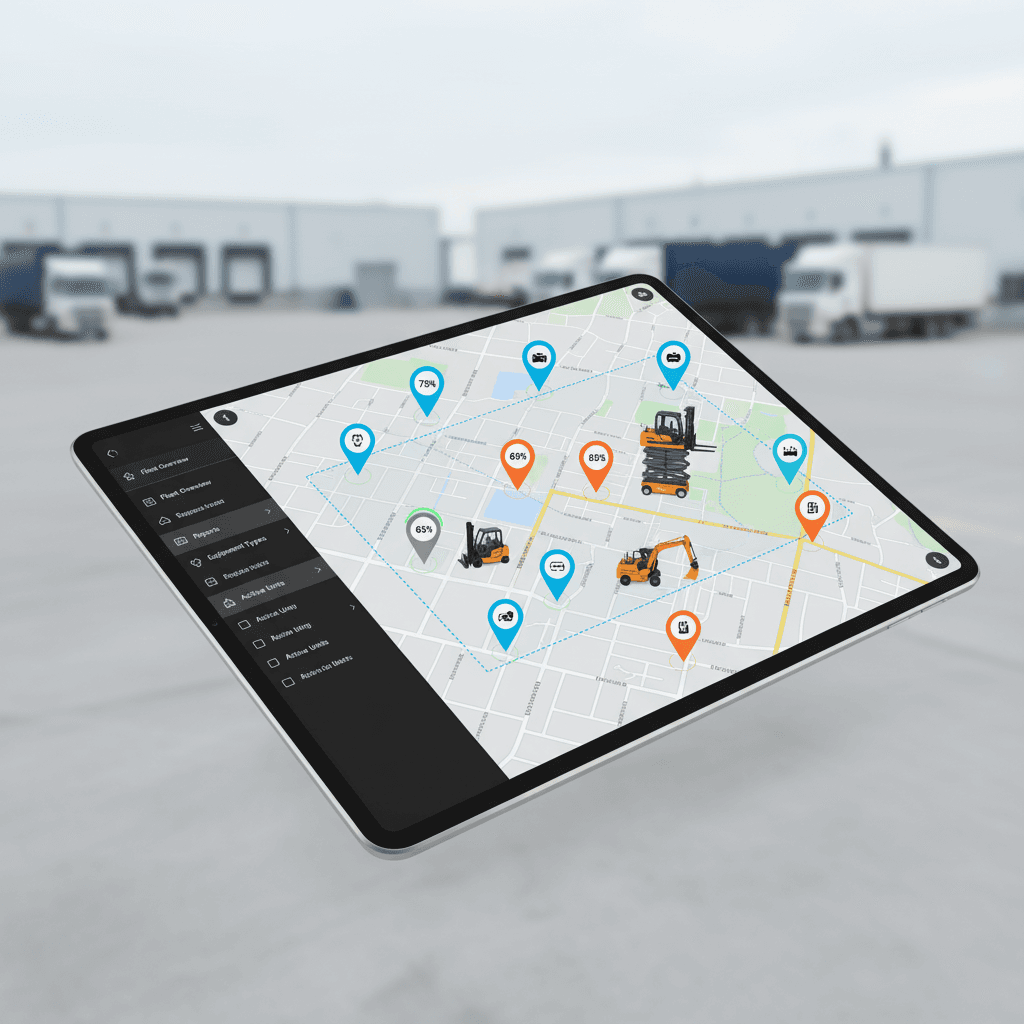
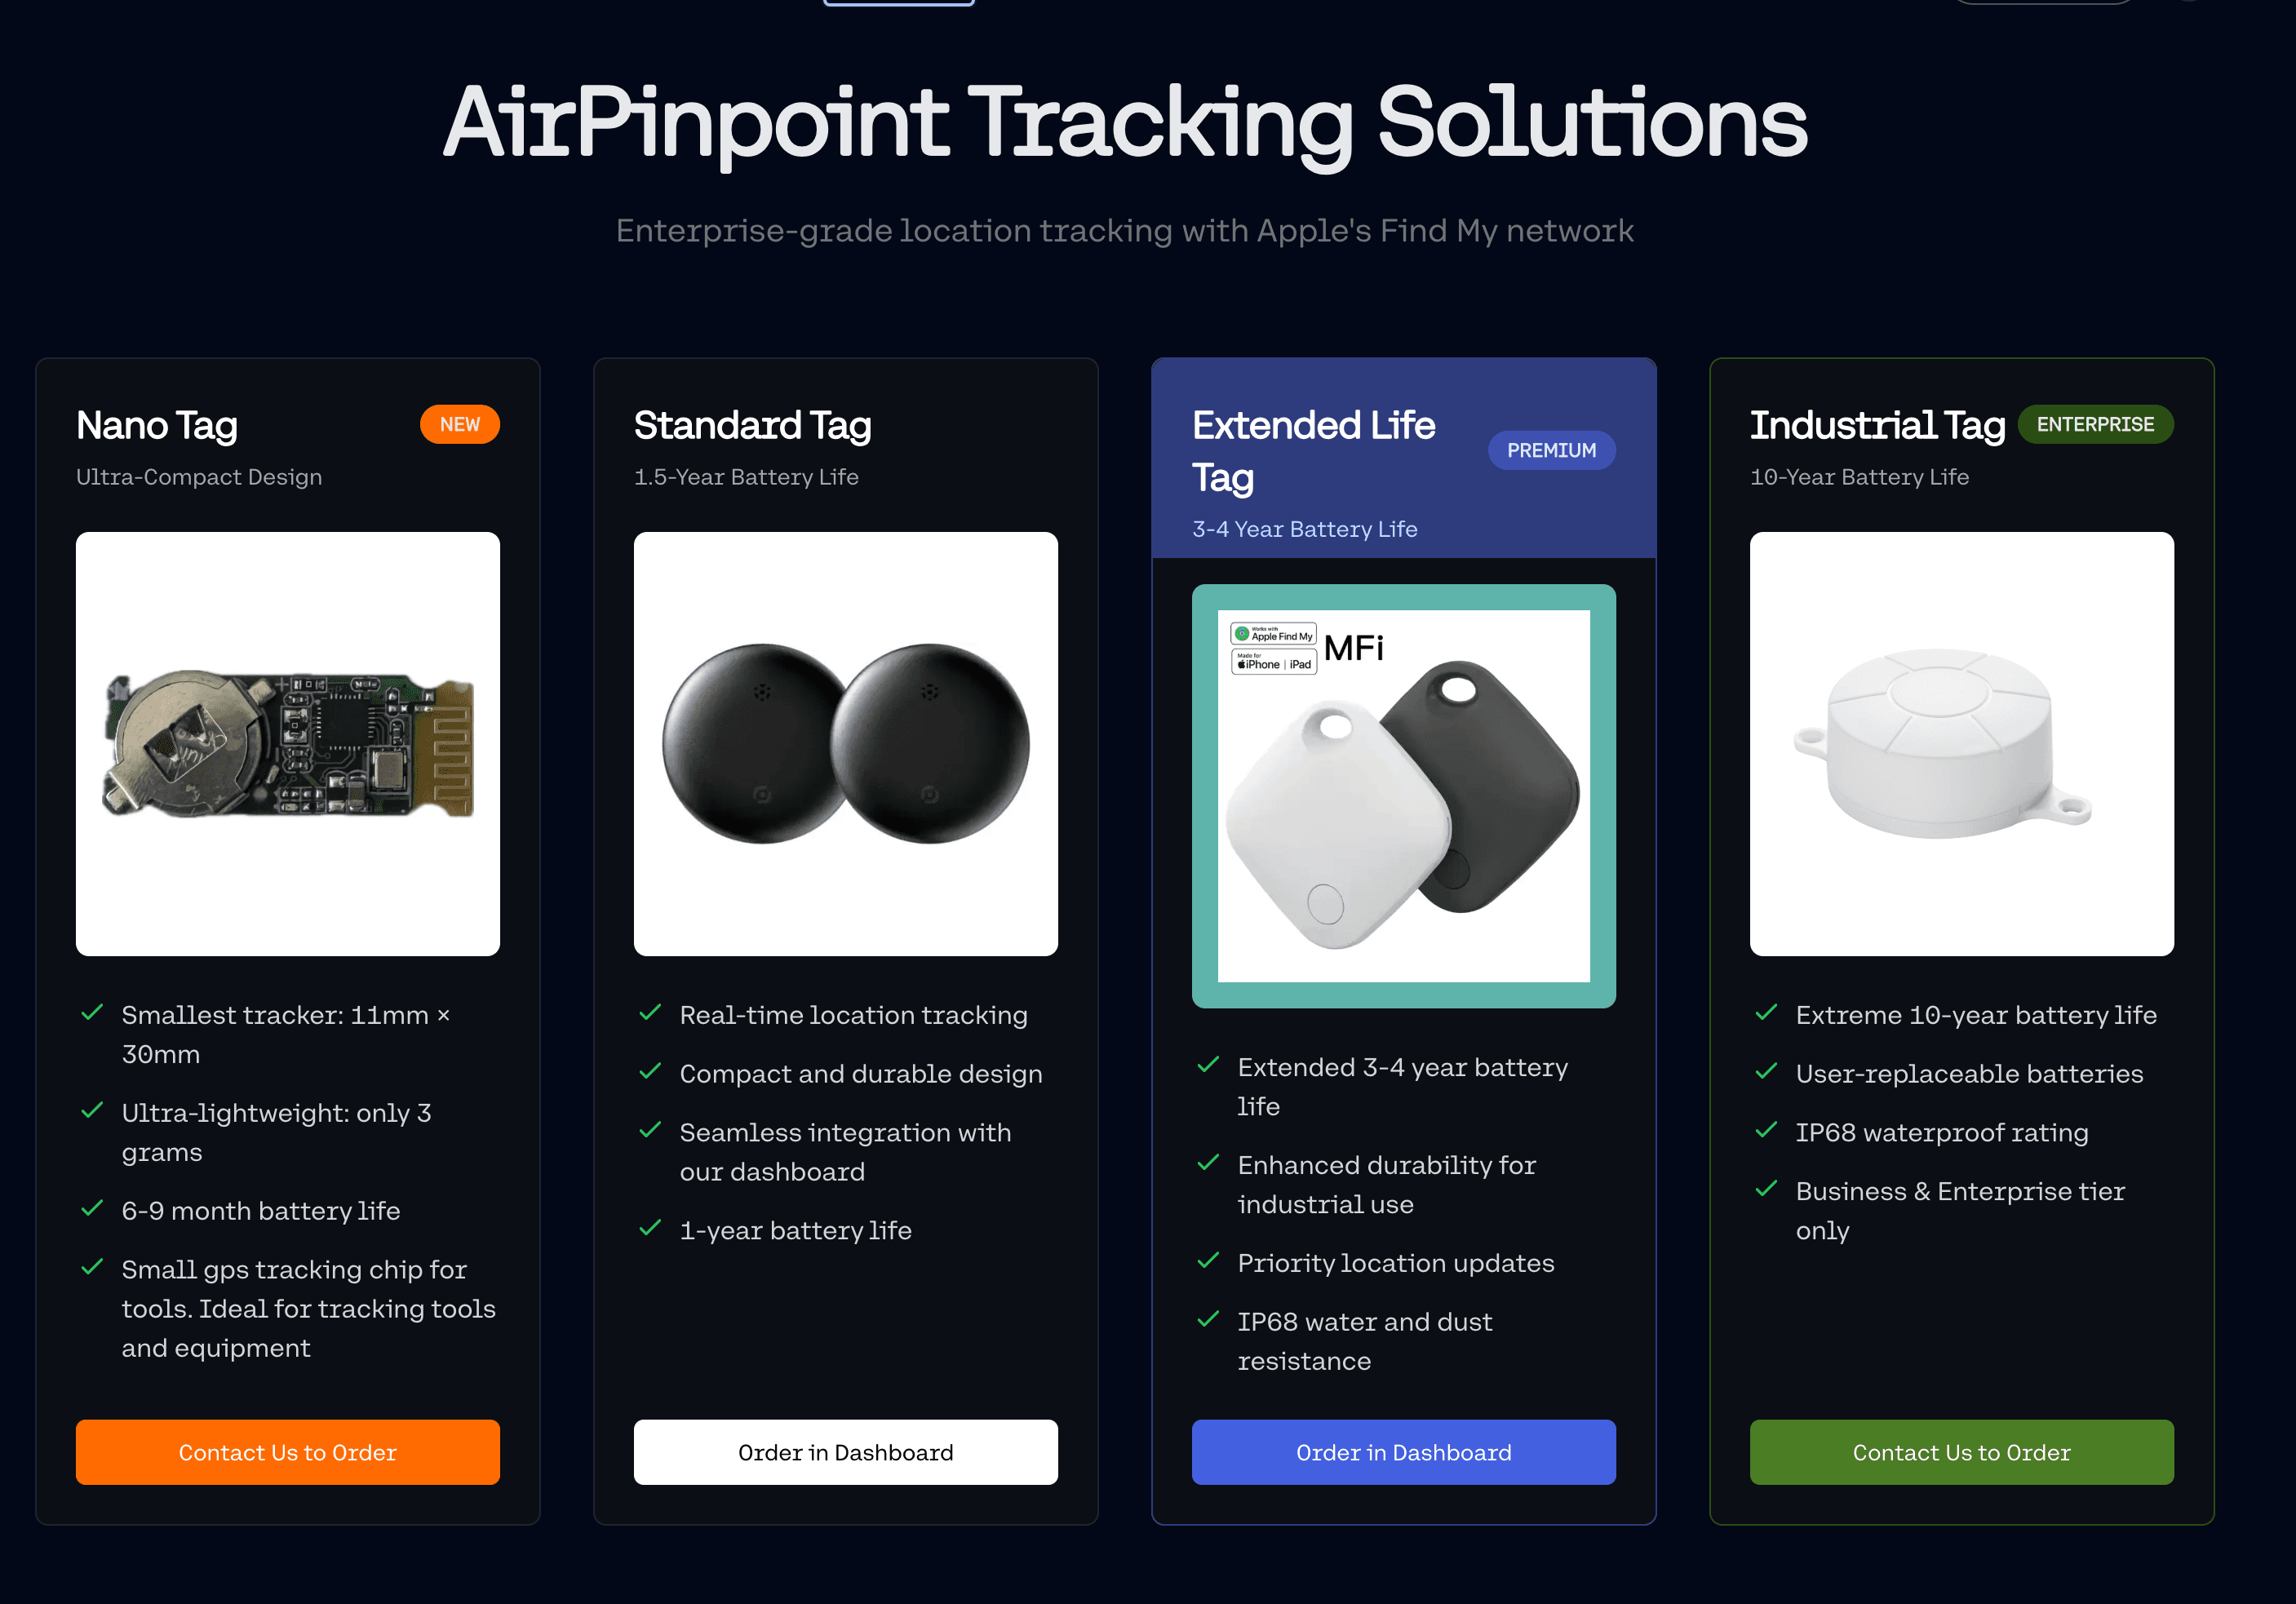
Airpinpoint solves one slice of that: it puts everything on one map, at a price per asset low enough that you can tag the whole fleet rather than the expensive tenth of it. What it deliberately does not do is replace the telematics portal, and the rest of this page is mostly about that line.
What a Unified Fleet View Delivers
- Accountability: every position report is timestamped and stored, so "where was it on the 14th" has an answer that is not a phone call.
- Efficiency: an asset that has not changed coordinates in three weeks is visible at a glance, which is the input to a redeploy or off-rent decision.
- Security: a geofence exit outside working hours raises an alert. Expect it 15 to 40 minutes after the crossing, not instantly, because it waits for consecutive readings to agree before firing rather than reacting to one stray fix.
- Coverage over depth: every asset reports the same two things, location and dwell time. Less per asset than telematics gives you, on far more assets.
What it does not deliver, stated plainly: no engine hours, no runtime, no idle detection, no mileage, no fuel, no fault codes, no maintenance scheduling and no service history. A Find My tag has no connection to the machine. If you need hours-based servicing, that is a telematics purchase and we will not pretend otherwise.
Core Modules
- Live map with search, filters and site overlays
- Inventory list view for counting and auditing across yards
- Polygon geofences with entry and exit alerts, delivered by email, Slack or WhatsApp
- Location history per asset, with CSV and JSON export
- Outbound webhooks on geofence entry and exit, for pushing events into your own systems
- REST API with a per-user key generated from the dashboard
- Team and organization permissions, so site managers see their sites
Not modules, because they do not exist: utilization dashboards based on runtime versus idle, a maintenance queue, service history, engine-hour reporting, predictive analytics, bulk CSV import, or prebuilt connectors to any third-party fleet platform. Integration is the API and the webhooks. If something on this list is a hard requirement, you need a different product, and it is better to find that out now.
Rollout Pattern
- Pick 2-3 representative sites and 3 asset classes. Include one class you are pessimistic about, such as equipment that lives inside a metal container or in a rural yard, so the pilot tests the weak case rather than the flattering one.
- Install, label and baseline for four weeks. Do not change any operational behaviour during this window. You are measuring what normal looks like, and if you start reacting to alerts in week one you lose the baseline.
- Check reporting frequency per asset class before you trust any of it. Coverage depends on Apple devices passing nearby, so a tag in a busy yard may report every few minutes while one in a remote outbuilding goes quiet for a day or more. Find out which of your assets are in which category now, not after rollout.
- Tune alerts, geofences and reporting windows. Geofences drawn too tightly around a yard generate noise from position drift at 10 to 30 meter accuracy. Give the boundary some margin.
- Scale to the rest of the fleet, and keep the baseline data. It is what you will compare against when someone asks next year whether this was worth it.
 Our Solution