Updated
Equipment Maintenance Tracking: Software, Methods, and Cost Comparison (2026)
The $50 Billion Problem
Search this topic and you will meet the same three numbers on every page: $50 billion a year in unplanned downtime for US manufacturers, $129 million per Fortune 500 facility, 25 downtime events a month. They are repeated so consistently that they read as established fact.
We went looking for the primary sources and could not land on ones we would stand behind. So we are not going to build an argument on them, and you should be wary of pages that do.
Your own number is more useful anyway, and it is two inputs: the hourly cost of a machine being down (crew standing idle, plus the rental or the delay penalty), times hours down last year. Most operations have never multiplied those two together. Do it before reading the rest of this page, because it sets the budget for everything that follows.
Much of it is preventable. The US Department of Energy's O&M Best Practices Guide, maintained by Pacific Northwest National Laboratory, estimates that a preventive maintenance program saves 12% to 18% over a reactive one, and that predictive maintenance saves a further 8% to 12% over preventive. For a facility running mostly reactive today, PNNL notes the available savings can exceed 30% to 40%.
That is the best-sourced benchmark in this field, and it is worth preferring over the vendor figures that dominate search results for this topic. Where numbers below are not attributable to a named source, we say so.
The difference between top performers and everyone else comes down to one thing: systematic maintenance tracking.
Four Levels of Maintenance Tracking
Not all maintenance tracking is equal. Organizations typically progress through four levels:
Level 1: Reactive (Run-to-Failure)
Fix equipment after it breaks. No tracking, no scheduling, no data. Emergency repairs cost more than planned ones for reasons that need no statistic: overtime rates, expedited parts freight, a crew standing around, and the repair happening at the worst possible moment rather than a chosen one. Nearly every operation runs at this level for at least some of its equipment, usually the assets nobody has gotten around to scheduling.
Level 2: Preventive (Calendar or Usage-Based)
Schedule maintenance at fixed intervals. Oil changes every 250 engine hours. Filter replacements every 30 days. Inspections every quarter. This is the minimum standard for any organization that takes equipment reliability seriously.
Key metrics at this level:
- PM Compliance: percentage of scheduled work orders completed on time (target: 95%+)
- Planned vs. Unplanned ratio: 80:20 is a widely used target. Measure yours first, then move it; the ratio you start at matters more than anyone's published average
Level 3: Condition-Based
Use sensor data and inspections to trigger maintenance when conditions warrant it, not on a fixed schedule. A vibration sensor detects bearing wear. An oil analysis shows contamination. A thermal camera catches an overheating motor. The work order gets created based on actual condition, not a calendar.
Level 4: Predictive
Machine learning models analyze historical failure patterns, sensor data, and operating conditions to predict failures before they happen. The US Department of Energy's O&M Best Practices Guide puts the return on a predictive maintenance program at roughly 10 to 1, with a further 8% to 12% cost saving over a preventive program.
Worth stating plainly: Airpinpoint does none of this. We have no sensors, no condition monitoring and no predictive models. This section is here because you should know what level 4 involves before somebody sells it to you.
Most small and mid-size operations should target Level 2 with selective Level 3 capabilities. Level 4 requires significant sensor infrastructure and data maturity.
CMMS Software Comparison (2026 Pricing)
CMMS (Computerized Maintenance Management System) software is the backbone of any maintenance tracking program. The market has matured significantly, with strong options at every price point.
Pricing Overview
| Platform | Free Tier | Entry Price | Mid-Tier | Enterprise |
|---|---|---|---|---|
| UpKeep | No | $20/user/mo | $45-75/user/mo | Custom |
| Fiix | Yes (basic) | $45/user/mo | $75/user/mo | Custom |
| Limble | Yes (limited) | $20/user/mo | $45/user/mo | Custom |
| MaintainX | Yes (limited) | $16/user/mo | $49/user/mo | Custom |
| eMaint | No | $69/user/mo | $85/user/mo | Custom |
| Spreadsheets | Yes | $0 | $0 | $0 |
When Each Option Makes Sense
Spreadsheets ($0): Under 20 assets, single maintenance person, simple PM schedules. You will outgrow this quickly.
Free CMMS tiers (MaintainX, Fiix, Limble): 20-50 assets, 1-3 maintenance staff. Good enough to build discipline around work orders and PM schedules before committing budget.
Mid-range CMMS ($20-75/user/mo): 50-500 assets, dedicated maintenance team. This is where most construction companies, rental fleets, and manufacturing plants land. UpKeep is mobile-first and popular with field teams. Limble is known for a clean interface and drag-and-drop scheduling. MaintainX has the lowest entry price.
Enterprise CMMS ($85-150+/user/mo): 500+ assets, multi-site operations, regulatory compliance requirements. eMaint and IBM Maximo serve this tier. Expect longer implementation timelines and higher total cost of ownership.
Feature Comparison
| Feature | Spreadsheets | Free CMMS | Mid-Range CMMS | Enterprise CMMS |
|---|---|---|---|---|
| Work order management | Manual | Yes | Yes | Yes |
| PM scheduling | Manual | Basic | Advanced | Advanced + AI |
| Parts inventory | Manual | Limited | Yes | Yes |
| Mobile app | No | Yes | Yes | Yes |
| Automated alerts | No | Limited | Yes | Yes |
| Reporting/analytics | Basic | Basic | Yes | Advanced |
| Multi-site support | No | No | Some | Yes |
| API/integrations | No | Limited | Yes | Extensive |
| Compliance/audit trail | No | Limited | Yes | Yes |
| Equipment location | No | No | No | Rare |
Notice that last row. Almost no CMMS platform includes real-time equipment location. This is the gap that matters most for organizations with mobile or distributed equipment.
The Missing Piece: Equipment Location
A CMMS tells you what maintenance needs to happen and when. It does not tell you where the equipment is right now.
For stationary manufacturing equipment, this is not a problem. The CNC machine is on the shop floor where it has always been.
For construction equipment, rental fleets, tool inventories, generators, trailers, and anything that moves between sites, location is the single biggest bottleneck in maintenance execution.
The Real Cost of Not Knowing Where Equipment Is
Consider a typical maintenance scenario without location data:
- CMMS generates a PM work order for an excavator (250-hour service)
- Dispatcher checks the last known location: Site A
- Technician drives to Site A (30 minutes)
- Excavator was moved to Site B last week
- Technician calls around, eventually locates it at Site C
- Technician drives to Site C (45 minutes)
- Service begins 90+ minutes late
This is not an edge case, but we are not going to attach a survey figure to it, because we do not have one worth citing and the numbers that circulate for "time spent locating equipment" trace back to vendor marketing.
Measure your own instead. It takes two weeks and one extra field on the work order: minutes spent locating the asset before work began. At the end of the fortnight you will have a real distribution rather than an average someone invented, and you will probably find it is bimodal. Most work orders lose nothing, because the machine was where the system said. A minority lose an hour or more. Those outliers are the entire business case, and an average would have hidden them.
How Location Tracking Fixes This
With real-time location data:
- CMMS generates the work order
- Dispatcher checks Airpinpoint dashboard: excavator is at Site C
- Technician drives directly to Site C (25 minutes)
- Service begins on schedule
What changed is step 2. The dispatcher stopped guessing. Time saved on this particular work order is the drive to Site A plus the phone calls plus the drive to Site C, and how often that scenario occurs in your operation is exactly what the two-week log above tells you.
The limit, stated honestly: location gets the technician to the right site. It does not tell them the machine is due, what failed, or whether the part is on the truck. That is the CMMS's job, and no amount of location data substitutes for it.
Where Airpinpoint Fits
Airpinpoint is not a CMMS. It does not replace UpKeep, Limble, or MaintainX. It is a location tracking platform built on Apple's Find My network that provides the location layer these platforms lack.
What Airpinpoint Does
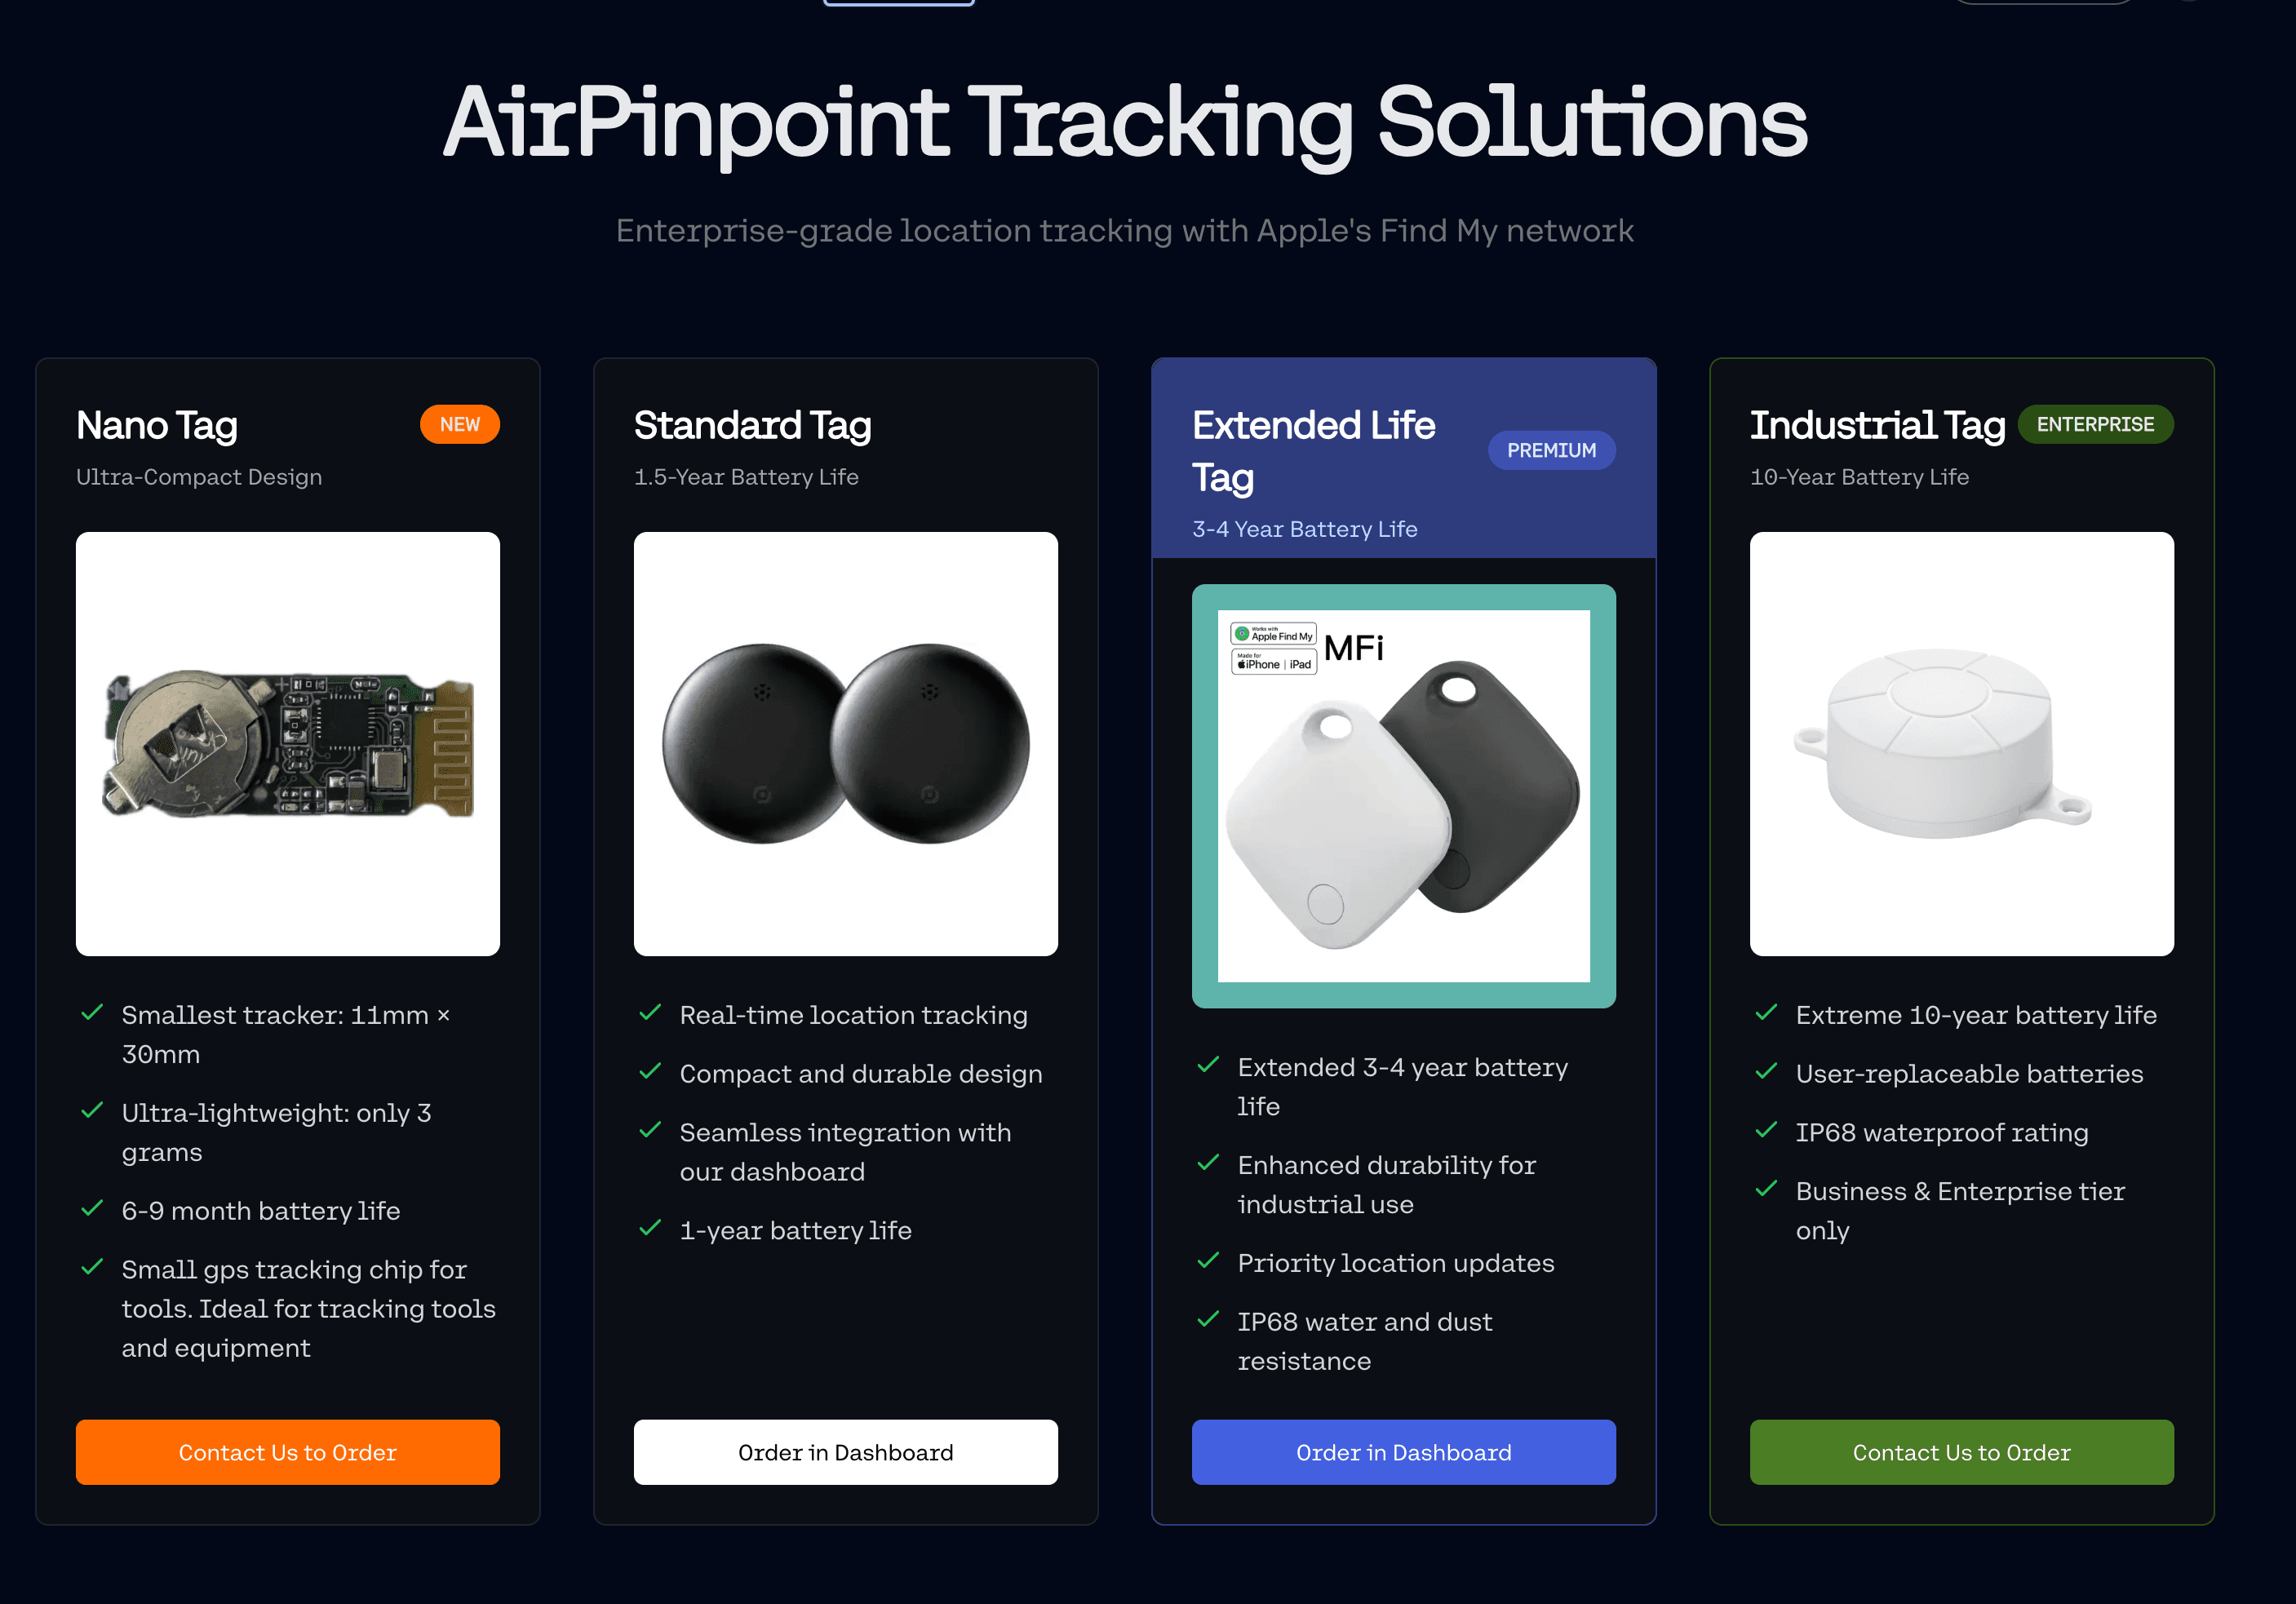
- Tracks equipment location across sites using AirTag-compatible hardware
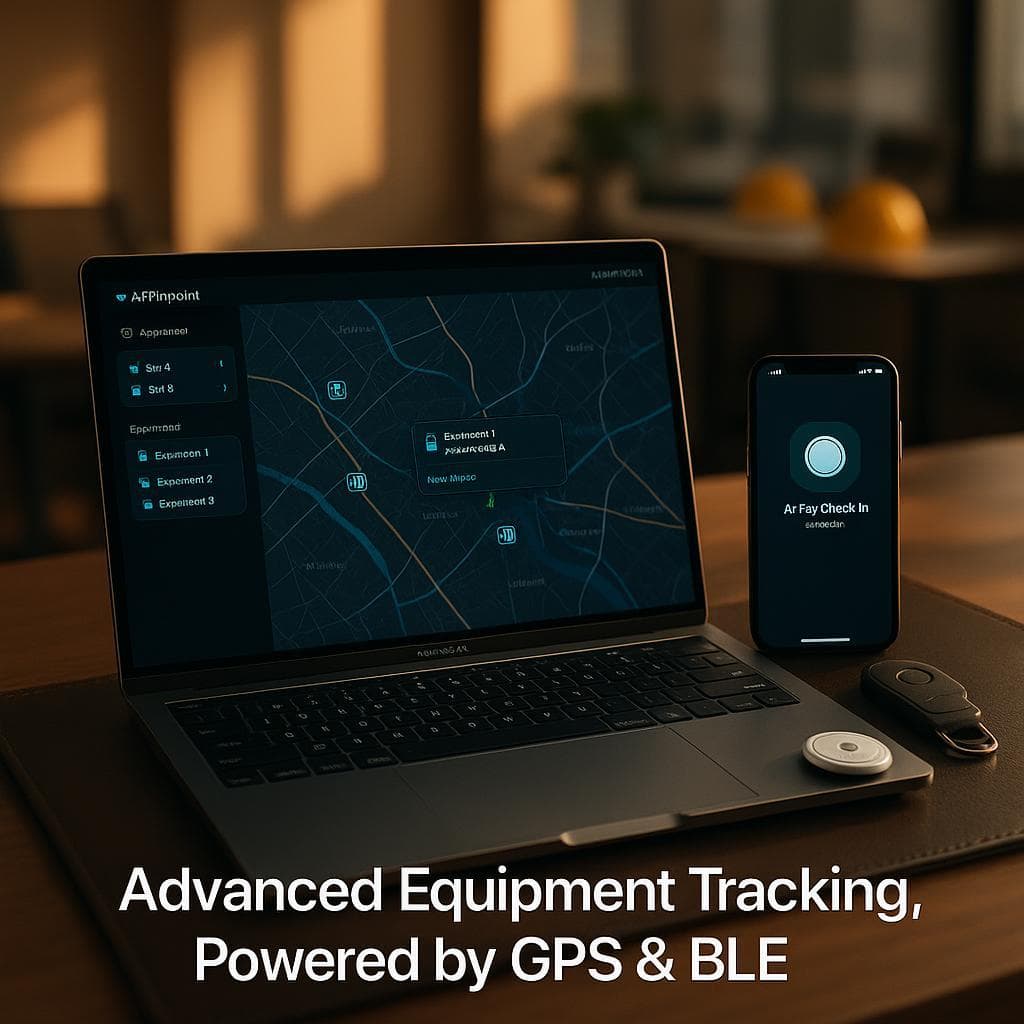
- Shows all equipment on a live map dashboard
- Sends geofence alerts when equipment enters or leaves defined zones
- Provides location history for audit and utilization analysis, exportable as CSV or JSON
- Fires outbound webhooks on geofence entry and exit, and exposes a REST API with a per-user key
- Sends alerts by email, Slack and WhatsApp
What Airpinpoint Does Not Do
- Work order management
- PM scheduling
- Parts inventory
- Compliance documentation
- Sensor-based condition monitoring
- Engine hours, fault codes or anything else read from a machine's ECU
- Predictive or machine learning analytics
- Pre-built connectors to any CMMS or third-party platform
- Bulk CSV import of an existing asset list
That list is longer than the one above it, deliberately. If a maintenance vendor's "does not do" list is shorter than their feature list, ask harder questions.
Pricing
| Component | Cost |
|---|---|
| AirTag hardware | $29 one-time per device |
| Business plan | $11.99/device/month |
| Enterprise plan | $14.99/device/month |
Compare this to cellular GPS trackers ($25-45/device/month plus hardware) or RTLS systems ($50-200/tag plus infrastructure). For organizations that need "where is it?" without real-time minute-by-minute tracking, Airpinpoint provides a significantly lower-cost option.
Integration Approach: CMMS + Location Tracking
The most effective maintenance tracking setup combines a CMMS for scheduling and work orders with a location platform for equipment visibility.
Recommended Stack by Organization Size
Small fleet (under 50 assets):
- CMMS: MaintainX or Limble free tier
- Location: Airpinpoint Business ($11.99/device/mo)
- Total: $11.99/device/mo + $0-16/user/mo CMMS
Mid-size fleet (50-200 assets):
- CMMS: UpKeep or Limble Starter ($20-45/user/mo)
- Location: Airpinpoint Business ($11.99/device/mo)
- Integration: geofence entry and exit webhooks, or no integration at all and a second browser tab
Large fleet (200+ assets):
- CMMS: eMaint or enterprise platform
- Location: Airpinpoint Enterprise ($14.99/device/mo) for mobile assets, GPS for vehicles
- Integration: your team builds against our REST API. There is no bidirectional sync and no pre-built connector; the API and the webhooks are the surface you get
How the Integration Works
There are three levels here, and most operations should stop at the first.
No integration. The maintenance dispatcher opens the Airpinpoint dashboard before assigning a work order and reads the location off the map. Costs nothing, works today, and captures nearly all of the benefit. Start here.
Webhooks. Airpinpoint fires an outbound webhook when an asset enters or leaves a geofence. If your sites are fenced, that gives your CMMS an arrival and departure event per asset per site, which is enough to keep a "current site" field current. Note the shape of this: it is event-driven on boundary crossings, not a continuous position feed.
REST API. A per-user API key from the dashboard, against which your team can pull current location and history. This is a build, not a configuration. We have no pre-built connector for any CMMS, and nothing here does bidirectional sync: location flows out of Airpinpoint, and nothing flows back in.
Implementation Guide
Phase 1: Foundation (Weeks 1-4)
Asset inventory. Before you can track maintenance, you need a complete list of what you own. For each asset, record: asset ID/serial number, manufacturer, model, purchase date, current location, and criticality rating (A/B/C).
PM schedule creation. Pull manufacturer-recommended maintenance intervals for every asset. Enter these into your CMMS as recurring work orders. Start with the most critical equipment (rated A) and work down.
Location tagging. Attach Airpinpoint tags to all mobile assets. Prioritize equipment that moves between sites frequently, since that is where location data saves the most time.
Phase 2: Discipline (Weeks 5-12)
PM compliance tracking. Measure on-time completion weekly. Target 90% in the first quarter. The industry average is 70-80%, so hitting 90% puts you ahead of most competitors.
Work order data quality. Every work order should capture: labor hours, parts used, failure cause (if unplanned), and completion notes. This data becomes the foundation for future analysis.
Baseline your metrics. Calculate your current MTBF, MTTR, planned vs. unplanned ratio, and equipment availability. You need a starting point to measure improvement against.
Phase 3: Optimization (Months 4-12)
Analyze failure patterns. Which equipment fails most often? Which failure modes repeat? Which assets cost the most to maintain? Use this data to adjust PM intervals. Some equipment needs more frequent service than the manufacturer recommends. Some needs less.
Route optimization. With location data and PM schedules combined, you can cluster work orders geographically. Send technicians to a site and have them complete all pending PMs at that location in a single trip rather than making separate visits.
Utilization analysis. Location data reveals how often equipment actually gets used. Assets sitting idle for weeks are candidates for redeployment or disposal. Assets running continuously may need more aggressive PM schedules.
Maintenance Metrics That Matter
Track these monthly. Trend over time. Share with your team.
| Metric | World-Class | Industry Average | Your Target |
|---|---|---|---|
| Equipment Availability | 92%+ | Measure your own | 85%+ |
| PM Compliance | 95%+ | Measure your own | 90%+ |
| Planned vs. Unplanned | 80:20 | Measure your own | 70:30 |
| MTBF (heavy equipment) | 800+ hours | Measure your own | Beat last quarter |
| MTTR (planned) | Under 4 hours | Measure your own | Beat last quarter |
| First-Time Fix Rate | 90%+ | Measure your own | 80%+ |
Improving from industry average to "your target" in this table does not require massive investment. It requires consistent execution on preventive maintenance, good data capture in your CMMS, and the logistical support of knowing where your equipment is at all times.
The Bottom Line
Equipment maintenance tracking is not a technology problem. Good CMMS software is available at every price point, including free. The real challenge is execution: building PM discipline, capturing quality data, and eliminating the logistical friction that causes work orders to slip.
Location tracking removes one specific source of that friction for mobile fleets: the work orders that stall because nobody knows where the machine went. It does not touch the other sources, and it is not a maintenance system.
Start with a CMMS for scheduling, because that is where the 12% to 18% preventive maintenance saving that PNNL documents actually comes from. Add location for mobile assets if your two-week log says you are losing real time to searching. Measure your metrics monthly against your own starting point, not against a benchmark table.
And keep the limits in view. A Find My tag reports position, not engine hours, so it cannot drive a usage-based service interval. It resolves to roughly 10 to 30 meters, which identifies a site rather than a bay. And it reports when an Apple device passes near it, so an asset parked at a remote site may not check in for a while.


 Our Solution